

ICE Mortgage Monitor: Property Insurance Costs Soar at a Record Pace in 2024
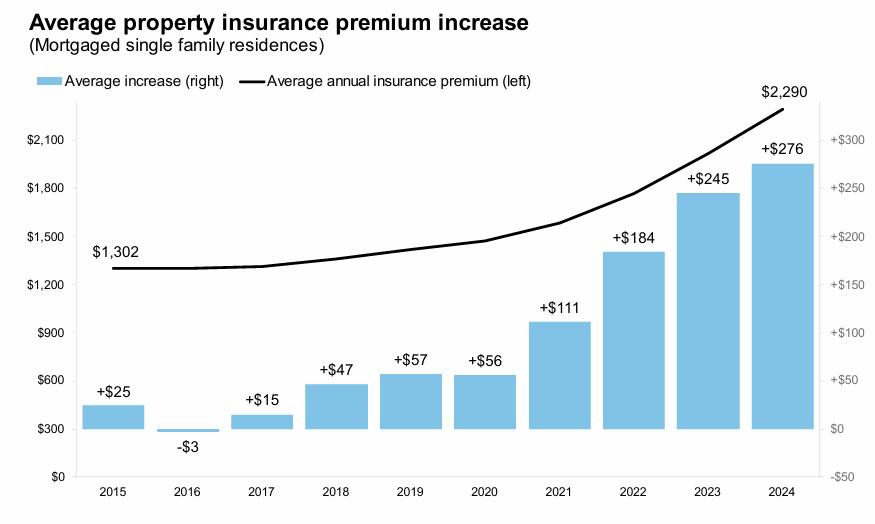
According to the ICE Mortgage Monitor report for March 2025, property insurance costs experienced a significant surge in 2024. The average annual property insurance premium for mortgaged single-family homes jumped by a record $276, or 14%, reaching $2,290. This increase caps a five-year rise of $872, a 61% increase.
Seattle and Salt Lake City saw the largest percentage increases in 2024, at 22% each, while Los Angeles saw a 20% increase. In terms of dollar amounts, Dallas experienced the largest increase at $606, followed by Houston at $515.
Interestingly, property insurance premiums grew at a rate less than half the national average in Florida, though rates there remain among the highest in the country. A record 11.4% of borrowers switched insurance carriers in 2024, up from 2 percentage points from the previous year. This shift is likely due to rising nonrenewal activity and borrowers seeking more competitive rates.
Homeowners are responding to these higher costs by opting for higher deductibles in exchange for premium savings. New borrowers have 19% ($390) higher deductibles and 12% ($284) lower premiums than the market at large.
“While it’s no surprise that insurance costs are rising,” said Andy Walden, Head of Mortgage and Housing Market Research for Intercontinental Exchange, “we’re beginning to see emerging trends in terms of how homeowners are responding to the higher cost environment. We’re seeing increases in both the share of borrowers switching policies and borrowers taking on higher deductibles as a way to combat rising premiums.”
These rising insurance costs are largely being driven by losses related to natural disasters.
These increases are part of a broader trend. Property insurance costs continue to be the fastest-growing component of monthly home payments, outpacing interest, principal, and property taxes. The average total mortgage payment (PITI) increased by 6% last year, with the 14% rise in property insurance costs significantly outpacing an 8% rise in interest payments and a 5% rise in property taxes among all outstanding mortgages.
Over the past five years, there has been a 21-22% rise in principal, interest, and tax payments among the active mortgage population, approximately one-third the rise in property insurance costs.
Mortgage Delinquencies Decline in January
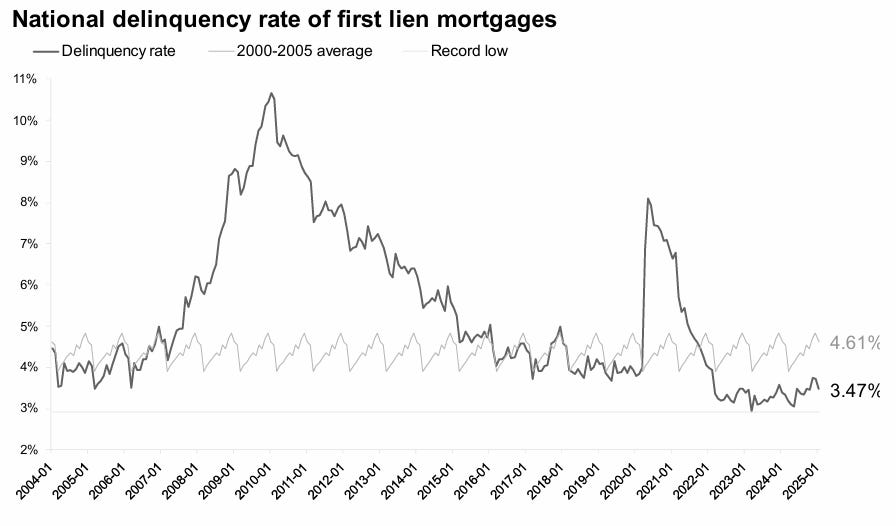
Despite rising insurance costs, mortgage delinquencies decreased nationally in January. Overall delinquencies fell by 24 basis points (bps) to 3.47% in January. While this is 10 bps higher than last year, it is 33 bps below pre-pandemic levels.
Hurricane-related delinquencies improved, dropping from 58,000 in November to 40,000 through January. However, wildfire-related delinquencies are starting to emerge in California, with an estimated 680 borrowers missing their January payment. In total, 490,000 previously delinquent borrowers became current in January, marking the highest volume in a year. Delinquencies improved across all stages of the mortgage process, though some of the decline in borrowers 90 or more days late is due to increased foreclosure referrals following the expiration of a VA foreclosure moratorium.
Foreclosure Activity Increases
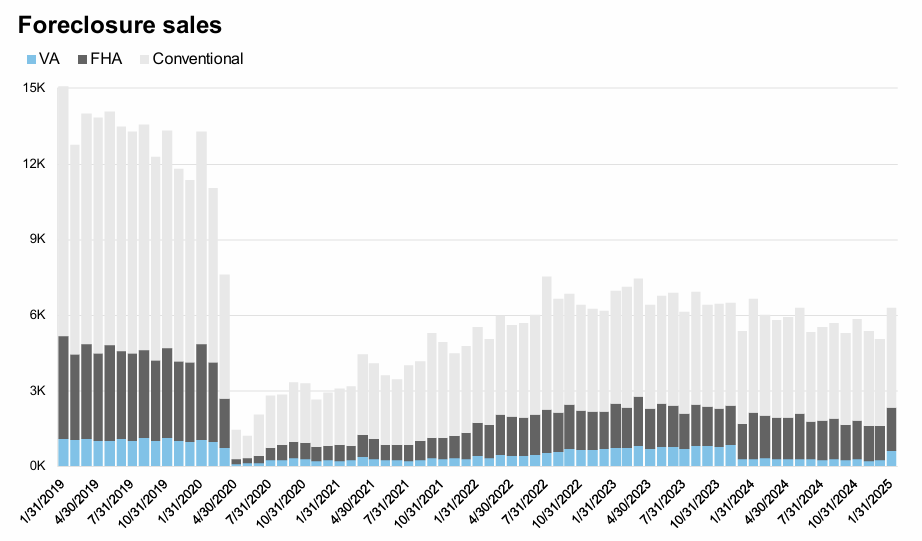
Foreclosure sales remain below pre-pandemic levels, but foreclosure starts have picked up following the end of the VA foreclosure moratorium.
Foreclosure starts jumped by 30%, and sales rose by 25% in January, and the number of active foreclosures rose by 7% following expiration of a recent moratorium on VA foreclosures. Increases in foreclosure activity are common in January, but foreclosure starts reached their highest level in 5 years; more than 40,000 loans were referred to foreclosure in January.
Compared to last year, foreclosure starts among FHA (-2%) and conventional (-4%) loans declined, with the annual increase primarily driven by the jump in VA referrals. Resumption of VA foreclosures – all else the same – could result in a roughly 15% increase in 2025 foreclosure referral activity compared to 2024. January foreclosure sales rose from December, but were down from the same time last year. Interestingly, they were down even with the resumption of VA foreclosure sales.
House Price Growth Slows
Annual home price growth saw a notable pullback in January, falling to 3.0% from 3.4% the previous month. The temporary rise in late 2024 was driven by the weak Q4 2023 rolling out of the backward-looking window.
Approaching Q2, annual gains will begin to more accurately reflect more recent trends, with an average seasonally adjusted annualized rate (SAAR) over the past 9 months of around 2.0%, and prices rising by a seasonally adjusted 0.12% (1.4% annualized) in January, the softest such growth rate in 5 months.
Inventory levels have improved in nearly every major market over the past 12 months, with the national deficit falling from -40% a year ago to -25% today. This should provide more options for prospective homebuyers as we head into the spring buying season, and help take some pressure off prices, barring a significant drop in 30-year rates.